BACK
task-gdpval-2
Prompt
You're an equity investor at UniCorn Fund. The fund has traditionally invested only in non-tech public companies. The MD is eager to build a position in the fast-growing tech space and has mandated purchasing a 4% and 2.5% stake in two of the most promising Mag7 companies.
(1) Which two companies would you recommend investing in, and why?
(2) Prepare a SEC 13-F style updated form for UniCorn Fund after these investments in docx format
(3) How much would each investment gain (% and $) by the time Q2 2026 earnings are announced? Model this in Excel. Assume you can build positions at an average stock price during May 2026.
(4) For each invested company, provide a waterfall of their total revenues in Q1 2026 (calendar) versus Q1 2025 (calendar), splitting the top 3 businesses and bucketing the rest as "rest"
(5) If either or both companies have $1Bn+ private investments, estimate the impact of them on EPS for Q2 2026. Assume all public information as of June 1, 2026. Give the excel working for this.
(6) Provide a pdf deck summarizing the key insights from above. Keep the deck to 4 slides excluding the cover and appendix
When possible, use attached sources. If not, search online for credible sources.
Reference Files (8)
Download all (.zip)mi-daily-gtm-us.pdf
public — Publicly downloaded; published market-insights / guide-to-the-markets report.
mag7_may_2026_line_charts_slide_deck.pptx
licensed — Licensed; Magnificent Seven price line charts built from Financial Modeling Prep (FMP) data (paid license).
mag7_earnings_estimates.pdf
licensed — Licensed; Magnificent Seven consensus earnings estimates (WSJ, paid license).
UniCorn Fund - current holdings.xlsx
expert_contributed — Author-generated; UniCorn Fund current holdings schedule (synthetic fund material).
Estimates.png
expert_contributed — Author-generated; market estimates exhibit (synthetic fund material).
Fund_investment_thesis.docx
expert_contributed — Author-generated; UniCorn Fund investment thesis (synthetic fund material).
CMO_Merrill_02-09-2026_ada.pdf
public — Publicly downloaded; published Merrill capital market outlook report.
report.pdf
public — Publicly downloaded; published research report.
Gold Deliverables (4)
Download all (.zip)Gold Trajectory
PHASE 1: Interpret thesis and ingest inputs
Purpose: Read the rules that govern every downstream calculation and survey all files before modelling.
Rationale: We read and pin the thesis rules first because the market screen, the Mega-Investment Exclusion, the forecast assumptions, and the Tax Uniformity rule drive every later number; if we modelled before fixing them, each workbook could apply a different convention.
Steps:
1.1 We read Fund_investment_thesis.docx and record the two market-screen thresholds (>$1T addressable within five years AND CAGR >=10%), the Mega-Investment Exclusion rule (strip the after-tax P&L of any single external investment over $1B), the forecast assumptions (5% QoQ off latest actual exclusion EPS, private stakes valued around Jun 1, public prices +2.5%/quarter, annual EPS = 4x quarterly), and the Tax Uniformity rule (apply each firm's last-quarter ETR to all streams). [rubric 1.1, 1.2, 1.3, 1.4, 1.5, 1.6, 1.7]
1.2 We read the prompt and enumerate the artifacts we owe: the investment selection, a 13-F report, a gain model, revenue waterfalls, a private-investment EPS model, and a summary deck, so we scope all six before building any one.
1.3 We load the current-holdings workbook, the May-2026 price deck, the market and earnings PDFs, the company reports (10Qs), and the estimates image into a single source register, so every input has a known provenance.
1.4 We create one assumptions register and have all models draw thesis rules, tax rates, valuation dates, and price inputs from it, so the same conventions flow consistently into every workbook. [output: assumption tabs in the Excel models]
PHASE 2: Screen markets and select investments
Purpose: Convert the thesis screen into a defensible recommendation of two Magnificent Seven companies.
Rationale: We let the thesis thresholds, not intuition, drive selection, and we document the market-to-segment mapping so each pick is justified by the screen rather than asserted.
Steps:
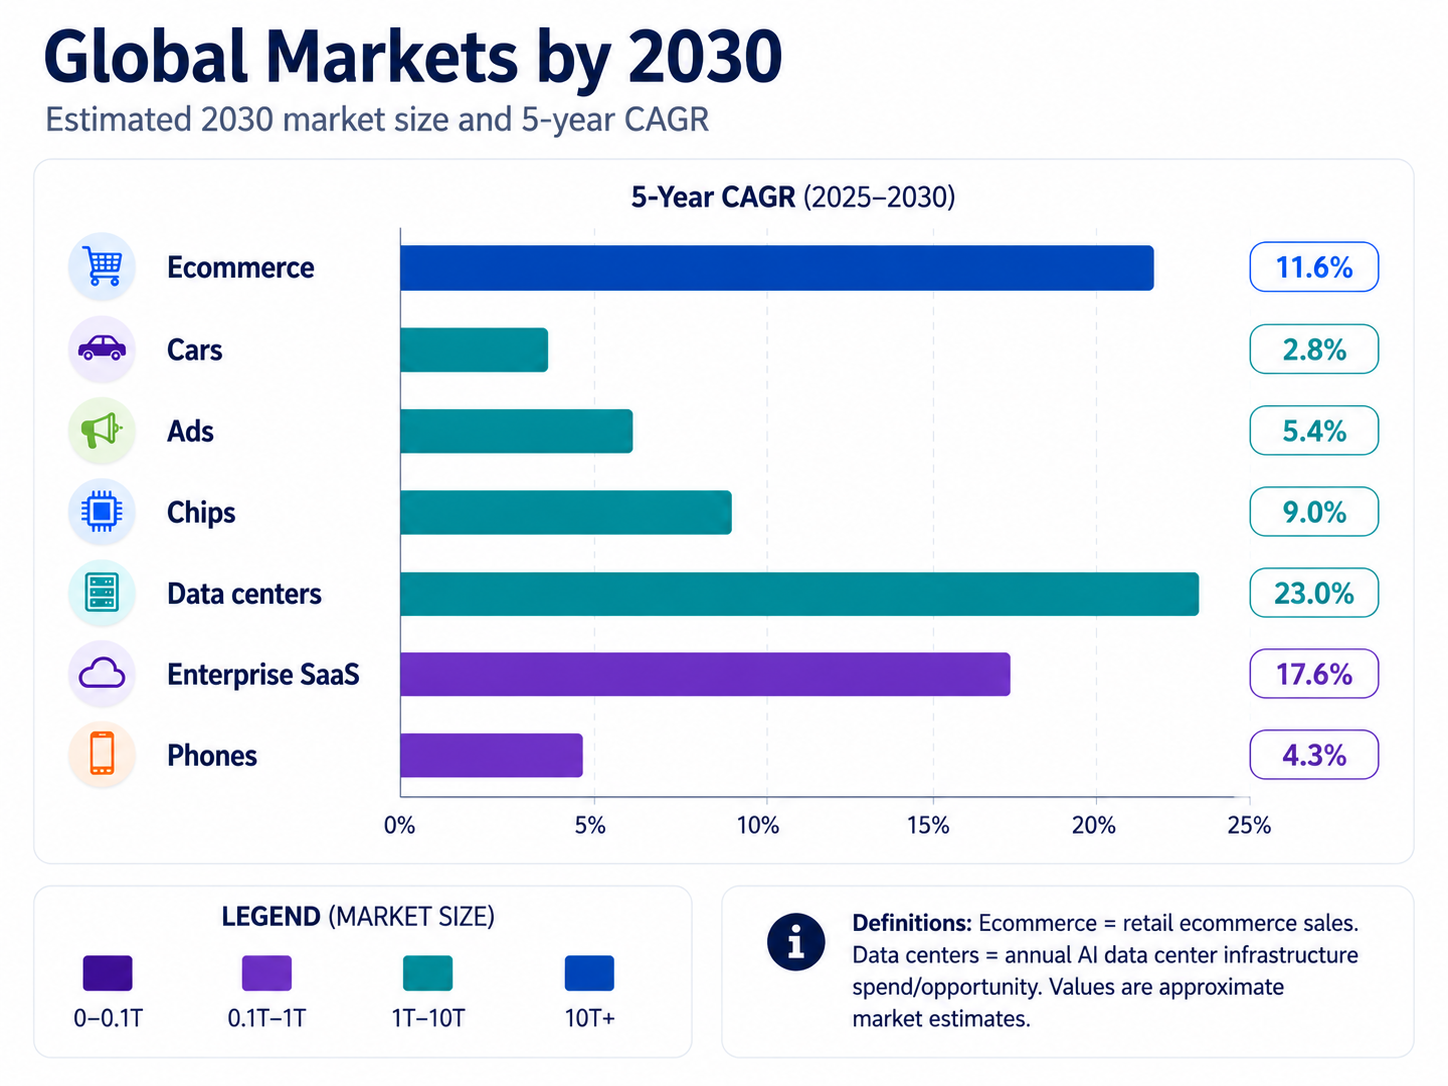
2.1 We apply both thresholds (>$1T within five years and CAGR >=10%) to the market data and isolate exactly the qualifying markets: e-commerce and data centers. [rubric 2.1, 2.2, 2.3]
2.2 We map Amazon's Online stores to e-commerce and AWS to data centers, and recommend Amazon for the 4% stake. [rubric 2.4, 2.6]
2.3 We map Microsoft's Azure and server/cloud exposure to data centers, recommend Microsoft for the 2.5% stake, and explain choosing it over Alphabet on playing in a faster growing enterprise SaaS market (vs. Ads for Alphabet). [rubric 2.5, 2.7]
PHASE 3: Construct post-investment 13-F
Purpose: Translate the investment mandate into a regulator-style holdings report and reconcile the funding from cash.
Rationale: We read the 4% and 2.5% mandates as percentages of each company's shares outstanding, not of fund NAV, because that is what determines share counts, position cost, and the cash drawdown that must reconcile.
Steps:
3.1 We interpret the stakes as percentages of shares outstanding and compute share counts from reported shares (SEC filings): Amazon about 430.0 million shares and Microsoft about 185.7 million shares. [rubric 3.1, 3.2]
3.2 We value the new positions at the May-2026 average build prices of $268.74 for Amazon and $417.59 for Microsoft. [rubric 3.3]
3.3 We set each position value as shares times price (Amazon about $115.6B, Microsoft about $77.6B) and confirm internal consistency. [rubric 3.4, 3.5]
3.4 We add the two holdings to the legacy 13-F table, produce the information table with the required fields and a correct portfolio total, and reduce cash from $250.0B to about $56.9B so the post-investment balance sheet reconciles. [rubric 3.6, 3.7] [output: UniCorn_Fund_Form_13F.docx]
PHASE 4: Gain model to Q2 2026 earnings
Purpose: Forecast each new position's value using normalized EPS, then calculate percent and dollar gains against the May build price.
Rationale: We forecast off Mega-Investment-Exclusion EPS rather than reported EPS so that one-off investment marks do not distort the operating earnings power we capitalize, and we apply each firm's own last-quarter ETR for tax uniformity.
Steps:
4.1 We derive latest-actual exclusion EPS by removing qualifying marks over $1B: for Amazon we remove the Anthropic +$16,807mm gain and the Rivian -$889mm loss (base exclusion EPS ~ $1.67), and for Microsoft we treat OpenAI as equity-method already excluded from the non-GAAP base (base exclusion EPS ~ $4.27). [rubric 4.1, 4.2]
4.2 We apply each firm's uniform last-quarter effective tax rate to the excluded items (Amazon 24.0%, Microsoft 19.2%) rather than a generic or spot rate. [rubric 4.3, 4.4]
4.3 We grow exclusion EPS 5% QoQ to the Q2 2026 estimate (Amazon ~ $1.75/qtr, Microsoft ~ $4.48/qtr) and annualize as 4x the quarterly figure (Amazon ~ $7.01, Microsoft ~ $17.93). [rubric 4.5, 4.6, 4.7, 4.8]
4.4 We apply the median Magnificent Seven forward P/E of 25x from a tier-1 broker (Goldman Sachs report on AI), setting forecast price = forward P/E times annualized exclusion EPS (Amazon ~ $175.33/sh, Microsoft ~ $448.18/sh). [rubric 4.9, 4.10, 4.11]
4.5 We calculate gain per share, gain percentage, dollar gain, and forecast position value versus the May average build cost. [rubric 4.12, 4.13, 4.14] [output: UniCorn_Gain_Model.xlsx]
4.6 We confirm the workbook is fully formula-driven and recalculates without errors, tying to Amazon about -34.8% / -$40.2B, Microsoft about +7.3% / +$5.7B, and combined net about -$34.5B. [rubric 4.15]
PHASE 5: Revenue waterfall
Purpose: Explain each selected company's Q1 2026 versus Q1 2025 revenue growth by top business lines and a remainder bucket.
Rationale: We disaggregate growth into the top three lines plus a Rest bucket and preserve the sign on declining lines, so the bridge reconciles start to end rather than masking offsetting moves.
Steps:
5.1 We pull disaggregated revenue for the comparable periods (calendar Q1 2026 versus Q1 2025) from each company's report (SEC filings). [rubric 5.1]
5.2 For Amazon we identify Online stores, third-party seller services, and AWS as the top three, with everything else in Rest; for Microsoft we identify Server products and cloud services, Microsoft 365 Commercial, and Gaming, with everything else in Rest. [rubric 5.2, 5.3]
5.3 We compute the YoY dollar and percentage change for each line with correct signs, keeping Microsoft Gaming as a decline rather than forcing all lines positive. [rubric 5.4]
5.4 We tie Amazon from $155.7B to $181.5B and Microsoft from $70.1B to $82.9B, ensuring top-three plus Rest equals total growth. [rubric 5.5, 5.6]
5.5 We build a waterfall/bridge chart per company that distinguishes increases, decreases, and endpoint totals, and confirm the workbook is formula-driven and recalculates without errors. [rubric 5.7] [output: UniCorn_Summary_Deck.pdf]
PHASE 6: Private-investment EPS impact
Purpose: Estimate whether qualifying private investments over $1B distort Q2 2026 EPS for Amazon or Microsoft.
Rationale: We test this as a wildcard because the same marks we excluded for forecasting could still move reported EPS, and the accounting treatment (net income vs OCI vs equity method) determines whether they do.
Steps:
6.1 We identify the qualifying private stakes over $1B as of June 1, 2026: Anthropic and OpenAI for Amazon, OpenAI for Microsoft. [rubric 6.1]
6.2 We record pinned June 1, 2026 valuation assumptions from credible public sources with retrieval dates noted, including Anthropic around $965B post-money and OpenAI around $852B. [rubric 6.2]
6.3 We apply the correct accounting treatment: Amazon preferred-investment marks flow through net income, Amazon convertible notes flow through OCI until conversion, and OpenAI is treated under equity-method logic. [rubric 6.3]
6.4 We compute the Amazon/Anthropic net-income-recognized after-tax EPS impact at about +$3.06 per share, and flag the full-mark upper bound at about +$7.10 per share. [rubric 6.4, 6.5] [output: UniCorn_Private_Investment_EPS.xlsx]
6.5 We conclude approximately zero incremental Q2 impact for the flat-valuation stakes (Amazon/OpenAI and Microsoft/OpenAI), with the Microsoft equity-method impact near zero, and confirm the workbook is formula-driven with sourced, auditable input cells. [rubric 6.6, 6.7]
PHASE 7: Summary deck
Purpose: Synthesize the recommendation, position sizing, valuation, revenue bridges, and EPS wildcard into a decision-ready deck.
Rationale: We write the deck as a set of conclusions supported by the workbooks, stating each conclusion before its support, so a decision-maker reads the recommendation rather than a spreadsheet walkthrough.
Steps:
7.1 We build a cover, exactly four content slides, and an appendix: thesis and selection; positions and valuation; revenue engines; and the private-AI-stake wildcard. [rubric 7.1]
7.2 We make every displayed number reconcile to a workbook or source and state the conclusion before the support. [rubric 7.2]
7.3 We append methodology, key assumptions, and sources. [rubric 7.3]
7.4 We run layout QA for overflow, overlap, and chart legibility, showing revenue as a waterfall consistent with Phase 5. [rubric 7.4] [output: UniCorn_Summary_Deck.pdf]
Scoring Rubric
Scoring type: binary_met_not_metTotal points: 100
Subtask 1: Interpret thesis & ingest inputs
weight 8| ID | Criterion | Category | Pts |
|---|---|---|---|
| 1.1 | Extracts both market-screen thresholds correctly (>$1T addressable within 5 yrs AND CAGR >=10%) | Extraction | 2 |
| 1.2 | States the Mega-Investment Exclusion rule (strip after-tax P&L of any single >$1B external investment) | Extraction | 2 |
| 1.3 | Captures the 5% QoQ growth assumption off latest actual exclusion EPS | Extraction | 0.5 |
| 1.4 | Captures private-stake valuation timing (~Jun 1, 2026) | Extraction | 0.5 |
| 1.5 | Captures public-price assumption (+2.5% per quarter) | Extraction | 0.5 |
| 1.6 | Captures annualization convention (annual EPS = 4x quarterly) | Extraction | 0.5 |
| 1.7 | Captures Tax Uniformity (each firm's last-quarter ETR applied to all streams) | Extraction | 2 |
Subtask 2: Screen markets & select investments
weight 12| ID | Criterion | Category | Pts |
|---|---|---|---|
| 2.1 | Applies the addressable-market-size threshold (>$1T within 5 yrs) to screen markets | Calculation | 1.5 |
| 2.2 | Applies the growth threshold (CAGR >=10%) to screen markets | Calculation | 1.5 |
| 2.3 | Isolates exactly the two qualifying markets (e-commerce, data centers) | Calculation | 1.5 |
| 2.4 | Selects Amazon at a 4% stake | Reasoning | 1 |
| 2.5 | Selects Microsoft at a 2.5% stake | Reasoning | 1 |
| 2.6 | Justifies Amazon by mapping Online stores -> e-commerce and AWS -> data centers | Reasoning | 2.75 |
| 2.7 | Justifies Microsoft (Azure -> data centers) and explains choice over Alphabet on a stated basis | Reasoning | 2.75 |
Subtask 3: Construct post-investment 13-F
weight 12| ID | Criterion | Category | Pts |
|---|---|---|---|
| 3.1 | Interprets each stake as a percentage of shares outstanding (not of fund NAV) | Reasoning | 1.5 |
| 3.2 | Computes share counts from reported shares outstanding | Calculation | 1.5 |
| 3.3 | Values positions at the May-2026 average build price ($268.74/sh Amazon; $417.59/sh Microsoft) | Calculation | 2 |
| 3.4 | Amazon position value = shares x price ~ $115.6B | Calculation | 1.5 |
| 3.5 | Microsoft position value = shares x price ~ $77.6B | Calculation | 1.5 |
| 3.6 | Output is a 13-F-style information table with required fields and a correct portfolio total | Artefact completeness | 2 |
| 3.7 | Positions funded from cash; post-investment balance sheet reconciles | Artefact consistency | 2 |
Subtask 4: Gain model to Q2 2026 earnings
weight 24| ID | Criterion | Category | Pts |
|---|---|---|---|
| 4.1 | Derives Amazon latest-actual exclusion EPS by removing qualifying >$1B marks (Anthropic +$16,807mm, Rivian -$889mm), giving base-quarter exclusion EPS ~ $1.67 | Calculation | 2 |
| 4.2 | Derives Microsoft latest-actual exclusion EPS (OpenAI treated as equity-method, already excluded from non-GAAP base), giving base-quarter exclusion EPS ~ $4.27 | Calculation | 2 |
| 4.3 | Applies Amazon last-quarter ETR (24.0%) to the excluded items, not a generic/spot rate | Calculation | 1.5 |
| 4.4 | Applies Microsoft last-quarter ETR (19.2%) to the excluded items, not a generic/spot rate | Calculation | 1.5 |
| 4.5 | Grows Amazon exclusion EPS 5% QoQ to the Q2 2026 estimate (~ $1.75/qtr) | Calculation | 1.5 |
| 4.6 | Grows Microsoft exclusion EPS 5% QoQ to the Q2 2026 estimate (~ $4.48/qtr) | Calculation | 1.5 |
| 4.7 | Annualizes Amazon EPS as 4x the quarterly figure (~ $7.01) | Calculation | 1 |
| 4.8 | Annualizes Microsoft EPS as 4x the quarterly figure (~ $17.93) | Calculation | 1 |
| 4.9 | Uses the median Mag7 forward P/E (25x) from a tier-1 broker as the multiple | Calculation | 3 |
| 4.10 | Amazon forecast price = forward P/E x annualized exclusion EPS (~ $175.33/sh) | Calculation | 1.5 |
| 4.11 | Microsoft forecast price = forward P/E x annualized exclusion EPS (~ $448.18/sh) | Calculation | 1.5 |
| 4.12 | Amazon gain correct vs May build price ~ -34.8% / -$40.2B | Calculation | 1.5 |
| 4.13 | Microsoft gain correct vs May build price ~ +7.3% / +$5.7B | Calculation | 1.5 |
| 4.14 | Combined net gain ~ -$34.5B | Calculation | 1 |
| 4.15 | Workbook is fully formula-driven (no hardcoded outputs), traceable across tabs, recalcs without errors | Format & integrity | 2 |
Subtask 5: Revenue waterfall
weight 18| ID | Criterion | Category | Pts |
|---|---|---|---|
| 5.1 | Pulls disaggregated revenue for the correct comparable periods (cal Q1 2026 vs Q1 2025) from each 10-Q | Extraction | 3 |
| 5.2 | Identifies Amazon's correct top-3 lines (Online stores, 3P seller services, AWS) with remainder as 'rest' | Calculation | 2 |
| 5.3 | Identifies Microsoft's correct top-3 lines (Server & cloud, M365 Commercial, Gaming) with remainder as 'rest' | Calculation | 2 |
| 5.4 | Computes YoY delta and delta% with correct signs, including Microsoft Gaming as a decline | Calculation | 3 |
| 5.5 | Amazon period totals tie to filings ($155.7B -> $181.5B) and the bridge reconciles start->end | Artefact consistency | 2.5 |
| 5.6 | Microsoft period totals tie to filings ($70.1B -> $82.9B) and the bridge reconciles start->end | Artefact consistency | 2.5 |
| 5.7 | Produces a waterfall/bridge chart per company distinguishing increases, decreases, and endpoint totals | Artefact completeness | 3 |
Subtask 6: Private-investment EPS impact
weight 18| ID | Criterion | Category | Pts |
|---|---|---|---|
| 6.1 | Identifies qualifying >$1B private stakes per company as of June 1 2026 (AMZN: Anthropic, OpenAI; MSFT: OpenAI) | Calculation | 3 |
| 6.2 | Sources updated valuations from credible public info with retrieval dates pinned (Anthropic ~$965B; OpenAI ~$852B) | Extraction | 3 |
| 6.3 | Applies correct accounting treatment (Amazon preferred -> net income vs convertible notes -> OCI; OpenAI -> equity method) | Reasoning | 4 |
| 6.4 | Computes net-income-recognized after-tax EPS impact (AMZN/Anthropic ~ +$3.06/sh) | Calculation | 2.5 |
| 6.5 | Flags the full-mark upper bound (~ +$7.10/sh) | Calculation | 1.5 |
| 6.6 | Concludes ~$0 Q2 impact for the flat-valuation stakes (AMZN/OpenAI; MSFT/OpenAI) | Reasoning | 2 |
| 6.7 | Workbook is formula-driven with sourced input cells; recalcs without errors | Format & integrity | 2 |
Subtask 7: Summary deck
weight 8| ID | Criterion | Category | Pts |
|---|---|---|---|
| 7.1 | Deck has the required structure: cover + exactly 4 content slides + appendix | Artefact consistency | 2 |
| 7.2 | Content slides accurately summarize prior findings with figures consistent with the workbooks | Artefact consistency | 3 |
| 7.3 | Appendix documents methodology, key assumptions, and sources | Artefact completeness | 2 |
| 7.4 | Visuals legible, no overflow/overlap; revenue shown as a waterfall consistent with Subtask 5 | Format & integrity | 1 |